Data platform
Analytics platform
One analytics platform across procurement, inventory, and in-transit sales: shared filters, governed measures, and a drill path from headline number to individual line.
- Role
- Data architecture, analytics design, full-stack build
- Timeline
- TBD
- Status
- In production
- Client
- Manufacturing & distribution — commercial and supply-chain analytics
The problem
Purchasing, inventory, and sales each analyzed the business in separate spreadsheets. Nobody could follow a purchase order through to yield and margin, see what aged inventory was actually costing, or quote product already in transit without rebuilding a workbook by hand.
The approach
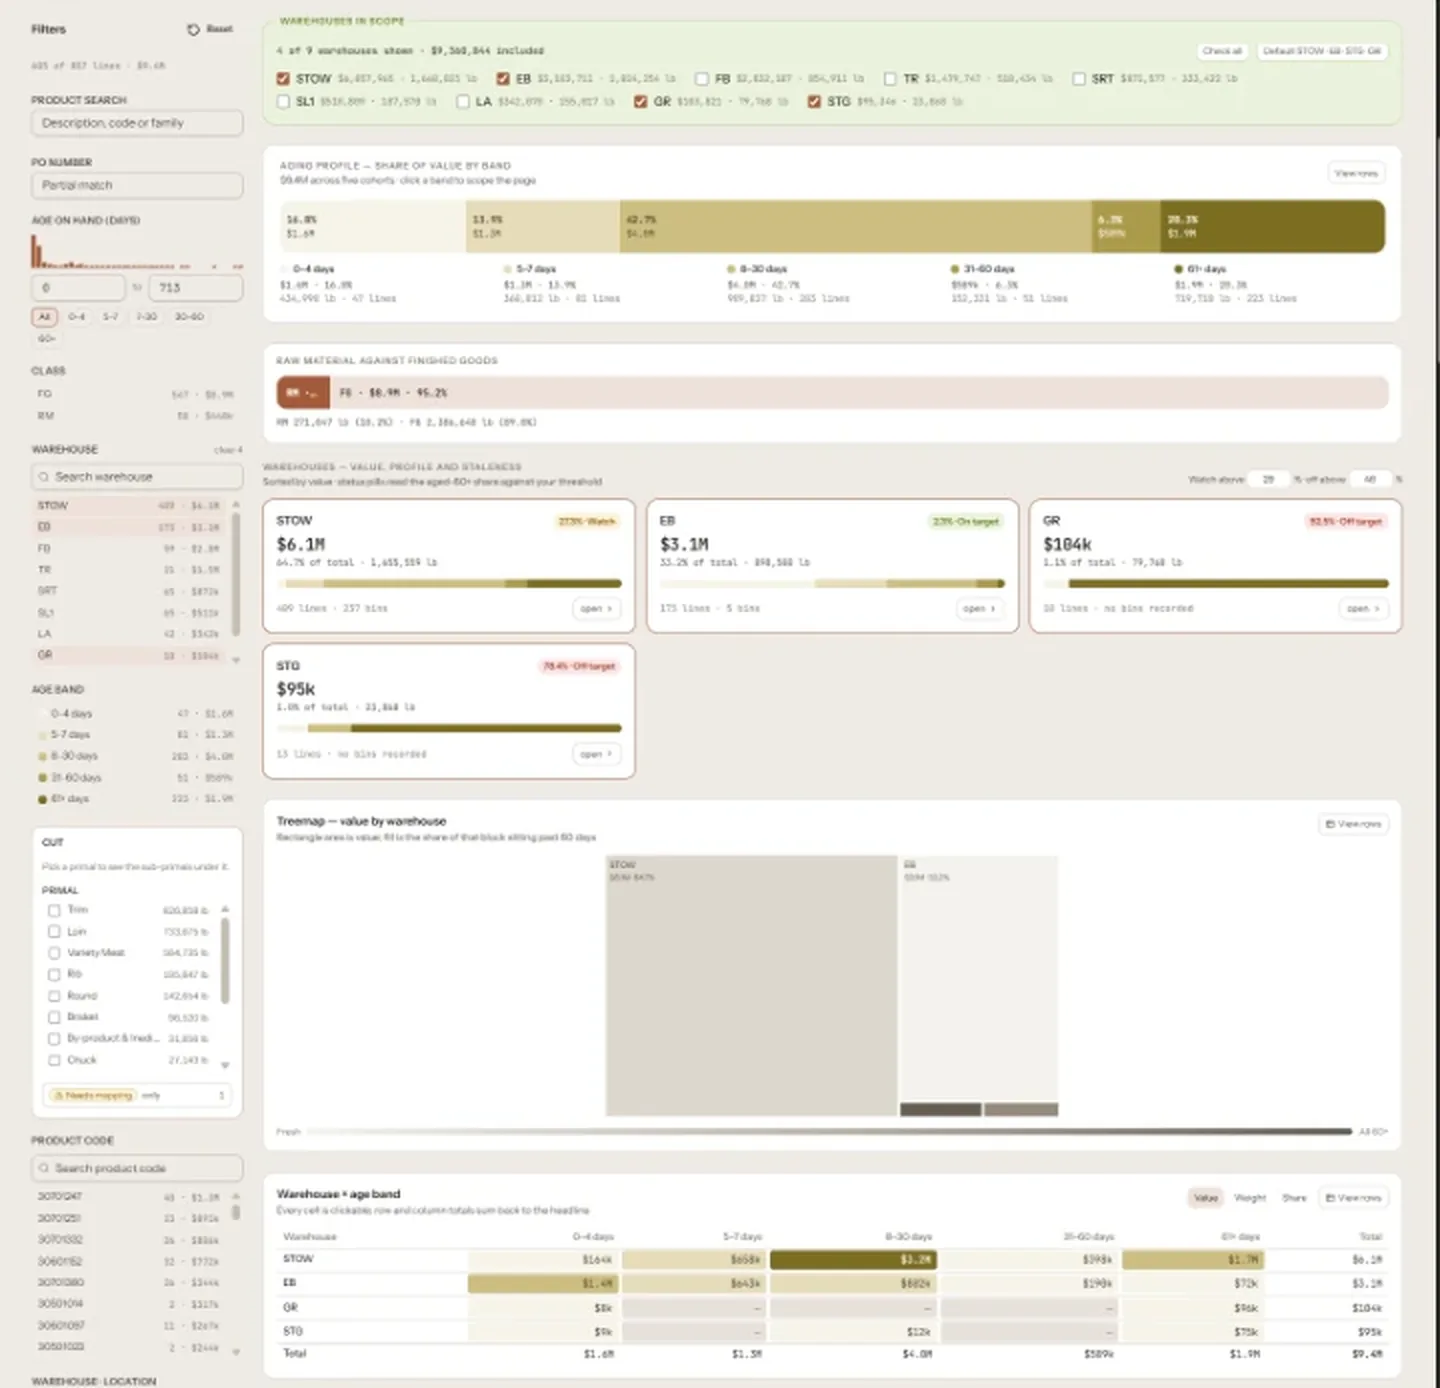
A single semantic layer defines the measures once — pounds, yield versus target, recovery, value, age band, margin — and every page reads them. Each view opens with an executive strip, then a filter rail and interactive visuals, then the underlying ledger, so a headline number can be drilled to the lot or line that produced it. Themes ship light and dark; every table exports.
The result
Procurement, operations, and sales work from the same measures, and questions that used to take a spreadsheet build now resolve in a few clicks. Cycle-time figures: TBD.
The stack
Inside the app
Real screens with branding blurred, or reproduced with anonymized data — no client names, logos, or user identities.
Want one of these for your operation?
If AI is the right answer, I’ll show you where. If it isn’t, I’ll tell you that too.
Tell me the outcome you need. I'll tell you what it takes, what it costs, and whether I'm the right person for it.