Data platform
Sales opportunity pipeline
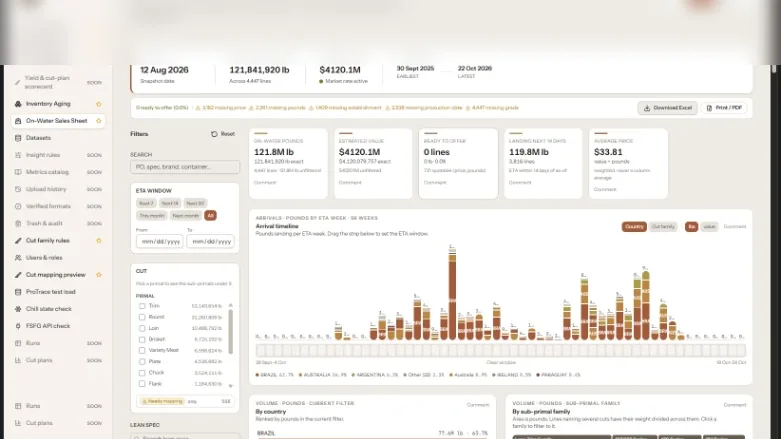
A pipeline view of sales opportunities tied to in-transit inventory: coverage, value, ETA, and quotable lines in one filterable dashboard.
- Role
- Data architecture, analytics design, full-stack build
- Timeline
- TBD
- Status
- In production
- Client
- Manufacturing & distribution — sales and procurement
The problem
Sales teams quoted from spreadsheets rebuilt every morning. Nobody could see which inventory was already in transit, how it was aging, or what was available to quote without double-selling.
The approach
A single dashboard connects inventory coverage, estimated value, arrival timeline, and quotable lines. Shared filters apply across every visual, and data-quality flags surface incomplete records before they reach a quote.
The result
Sales and procurement now work from the same live view. Quote cycle time and double-booking incidents: TBD.
The stack
Inside the app
Real screens with branding blurred, or reproduced with anonymized data — no client names, logos, or user identities.
Want one of these for your operation?
If AI is the right answer, I’ll show you where. If it isn’t, I’ll tell you that too.
Tell me the outcome you need. I'll tell you what it takes, what it costs, and whether I'm the right person for it.