Dashboards
Plant Monitor
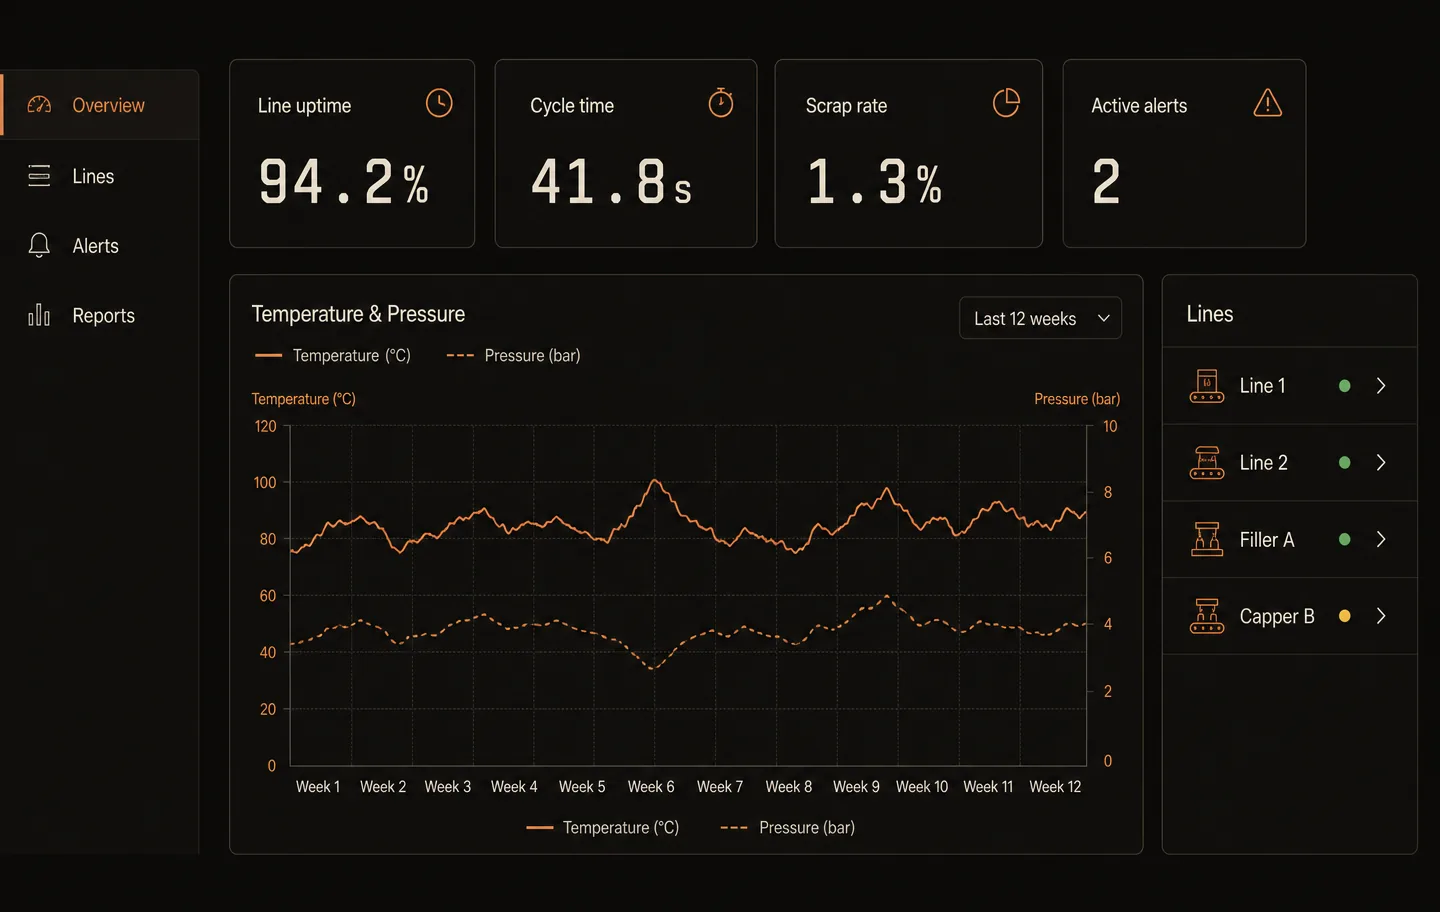
Live plant-floor telemetry over a TimescaleDB hypertable, with continuous aggregates so a twelve-week view renders as fast as a one-hour view.
- Role
- Architecture, data model, full-stack build
- Timeline
- TBD
- Status
- Live
- Client
- Manufacturer — plant operations
The problem
Line supervisors were reading machine conditions off local HMIs and transcribing them into spreadsheets. Nobody could compare this shift to last month, and by the time a trend was visible the product was already out the door.
The approach
Sensor readings land in a TimescaleDB hypertable with continuous aggregates rolled up at the intervals the floor actually asks for. The app reads the aggregate that matches the selected range instead of scanning raw rows, so range switching stays instant. Thresholds and alert states are configuration, not code.
The result
One live view of the floor that supervisors keep open on the wall display, with history that goes back far enough to argue with. Exact uptime and scrap deltas: TBD.
The stack
Inside the app
Real screens with branding blurred, or reproduced with anonymized data — no client names, logos, or user identities.
Want one of these for your operation?
If AI is the right answer, I’ll show you where. If it isn’t, I’ll tell you that too.
Tell me the outcome you need. I'll tell you what it takes, what it costs, and whether I'm the right person for it.