Dashboards
Daily operations report
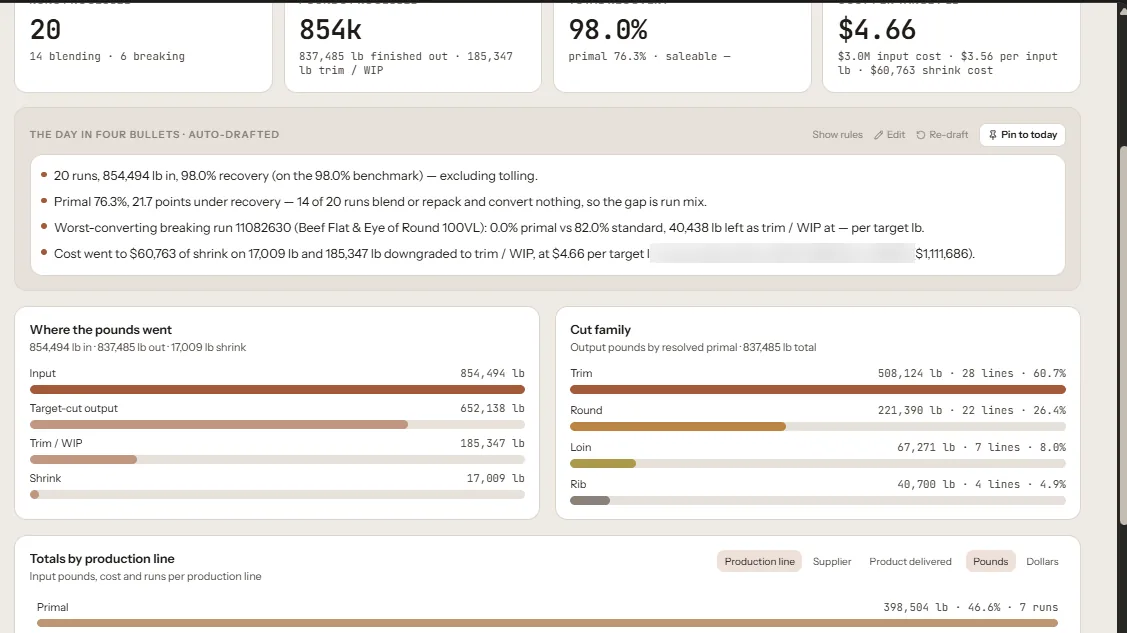
An auto-drafted daily run report: recovery, yield, shrink cost, and where every pound went — written in plain language before the morning meeting.
- Role
- Data architecture, metric definition, full-stack build
- Timeline
- TBD
- Status
- In production
- Client
- Manufacturing — plant operations and finance
The problem
The morning production meeting started with someone rebuilding yesterday's numbers by hand. Recovery, downgrade, and shrink cost lived in separate exports, so the discussion was about whose spreadsheet was right instead of what went wrong on the floor.
The approach
Runs, cut plans, and supplier receipts resolve into one daily model with the metrics defined once — recovery against benchmark, first-quality percentage, WIP downgrade, and shrink cost per target unit. A rules engine drafts the day in four bullets, and every headline number drills through to the run and line behind it.
The result
The meeting now opens with a report nobody had to assemble. Worst-converting runs and cost drivers are named automatically instead of found later.
The stack
Inside the app
Real screens with branding blurred, or reproduced with anonymized data — no client names, logos, or user identities.
Want one of these for your operation?
If AI is the right answer, I’ll show you where. If it isn’t, I’ll tell you that too.
Tell me the outcome you need. I'll tell you what it takes, what it costs, and whether I'm the right person for it.