Dashboards
Operations Pulse
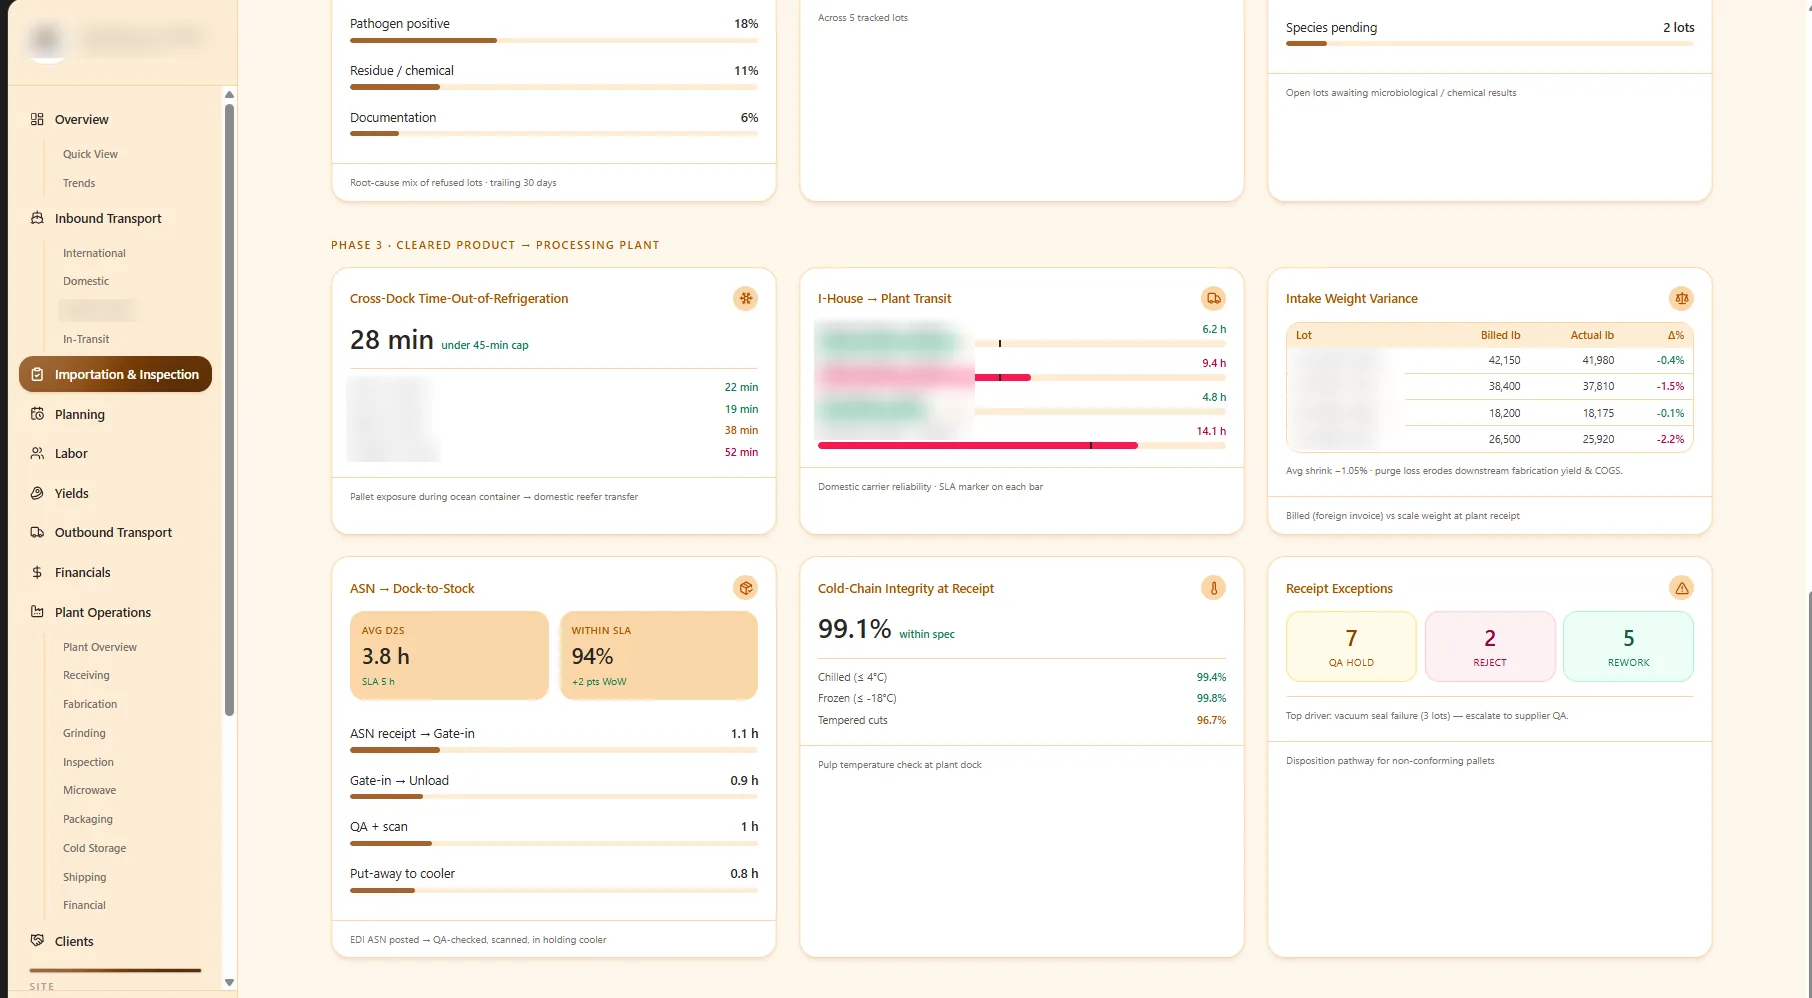
A management dashboard driven by a governed metrics catalog: metrics are defined once, published to the time-series store, and read identically by every app.
- Role
- Metrics architecture, full-stack build
- Timeline
- TBD
- Status
- Live
- Client
- Manufacturer — leadership team
The problem
Every department had its own version of the same number. Meetings started with reconciling definitions instead of making decisions.
The approach
A metrics catalog holds the definition, owner, unit, and grain for each metric. A publishing job writes computed values into the time-series store, and every surface — dashboard, export, downstream app — reads that one series. Nothing recomputes a metric in the presentation layer.
The result
A single set of numbers for the leadership meeting, each one traceable to its definition and its owner. Adoption and reporting-cycle figures: TBD.
The stack
Inside the app
Real screens with branding blurred, or reproduced with anonymized data — no client names, logos, or user identities.
Want one of these for your operation?
If AI is the right answer, I’ll show you where. If it isn’t, I’ll tell you that too.
Tell me the outcome you need. I'll tell you what it takes, what it costs, and whether I'm the right person for it.